
In the fall, the finance department asks you for the 2027 headcount. Your production lines are already running with temporary workers called in the day before, overlapping vacations, and positions that few operators are qualified to handle.
Workforce planning tells you, 3 to 18 months in advance, How many independent workers per position, team, and month You'll need it. An annual FTE (full-time equivalent) calculation doesn't account for this, because it might cover the entire year but leave the night shift without a dispatcher.
What is workforce planning?
Workforce planning compares what your workshop will need with what it has available, in order to determine How many qualified people, in what positions, and when?.
She then decides how to bridge the gap. Within an organization, she acts as the link between the multi-year strategy and day-to-day operations.
| Exercise | Horizon | Question asked | What We Decide |
|---|---|---|---|
| Strategic workforce planning | Several years | What jobs and skills will be in demand in the future? | Employment and Skills Guidelines |
| Workforce Plan | A few months to a year and a half | How many self-employed workers per position per month? | Hiring, Temporary Staffing, and Budget Training |
| Assignment Schedule | Day, week | Who will be in which position tomorrow? | Assignments and Substitutions |
On a production line, a vacant position slows down or halts production, and only a trained person can resume work there. Therefore, in addition to FTEs, you count the number of independent workers on a per-station basis.
Being one step ahead is just as important as the calculation itself, because in industry, Nearly one in two hiring projects is considered difficult by employers, according to the’France Travail's 2026 BMO Survey.
What are the steps involved in a workforce plan?
A workforce plan follows six steps, repeated each month, which you can complete in a single workshop.
- The hours to be covered are calculated on a position-by-position basis for the coming year.
- You convert these hours into person-hours, based on the time spent in the position.
- Team by team, you check who is capable of working independently in critical positions.
- Projections for demand and current supplies are made on a month-by-month basis, with a low-case scenario and a high-case scenario.
- Each deviation is assigned a lever and a launch date.
- The monthly review of production helps refine the plan.
The second step is where the calculation quickly goes awry, when you divide the hours to be covered by the paid time.
How do you calculate the staffing needs for a workshop?
The staffing requirement for a workshop is calculated by dividing the number of hours to be covered by the hours a person actually spends at work.
You’re probably dividing by 1,607 hours, the legal full-time workweek. This figure is the annual threshold beyond which hours are considered overtime. It already excludes paid time off and holidays, and still includes everything that keeps a person away from their job.
- Absences account for 118 hours, with a 7.37 % rate measured among blue-collar workers in 2024 by the WTW Absenteeism Barometer.
- The training program takes up 21 hours per year, as assumed in the hypothetical example below.
- Time not spent on duty, including breaks and meetings, amounts to 34 hours—at a rate of 10 minutes per 8-hour day—another assumption in this example.
- There remains approximately 1,434 hours in the position, your division's base.
Look at your absenteeism rates over the past 12 months, because they provide a better picture of your teams than a national barometer. Exclude from the rate any long-term absences that were already known and are accounted for in the schedule as of their respective dates.
Calculate the staffing needs for your workshop
Default values: the fictional workshop from the example, in 2027. Replace them with your own numbers, and the calculation will update.
Required Staffing Levels
48,0 FTE
Hours to be covered per year68,832 hours
Hours on duty per person1,434 hours
Number of people per position4.0 for 3 teams
By dividing by 1,607 hours42.8 FTE
Dividing by 1,607 hours would result in 5.2 FTE less than the actual need.
Assumptions: 1,607 full-time hours, 8-hour workdays, 7 weekday holidays in 2027 excluded from the Monday-through-Friday work schedule. Training and time off the job are assumptions for this hypothetical example. Enter any long absences you already know about by their dates, excluding them from the absenteeism rate. No data entered is saved.
What if your job follows a shift schedule? The hours you need to cover are worth volume × standard time ÷ efficiency.
- Standard time is the time allocated for a unit; efficiency is the portion of that time that the shop actually uses.
- A production line that is expected to produce 500,000 units per year at a rate of 0.6 minutes per unit represents 5,000 hours of theoretical work.
- At an efficiency of 85 %, it requires 5,882 hours of time spent at the workstation, which you then divide by the number of hours a person spends at the workstation.
Overall ratios—such as the number of people per unit of volume—are useful for a support service. For a repair shop, however, they are too crude because they do not take into account the hours during which each position is staffed.
How many people are needed to staff a 3×8 shift?
Monday through Friday, a 3×8 shift requires nearly 4 full-time employees, and about 6 on a continuous basis, 7 days a week. For a 2×8 schedule with two shifts, allow for nearly 3 people per shift.
After accounting for time off, absences, and training, each employee is on duty only about three out of every four days the store is open. If you operate with three employees per shift, temporary staff and overtime cover the fourth day.
A full roster can play the entire game without a setter
When the night shift doesn't no standalone adjuster, the line stops at the first change in format, regardless of the total number of employees.
The FTE calculation assumes that each employee is proficient in all positions. However, based on a sample of 210 sites we serve, the median proportion of operators qualified for at least two positions is 12.5 %, with half of the sites falling below that figure.
- The inspection begins with the critical workstations—those that shut down the line, require authorization, or rely on one or two people.
- A person is considered to be on duty when they are working independently—that is, when they are the only one in the position and their authorizations are up to date.
- Trainees do not yet count, even if they are already working in the position with a mentor by their side.
- The goal is to’one independent person per team, plus one on standby, or 4 per critical position on a 3×8 schedule.
In our hypothetical workshop, there are 6 independent adjusters out of the 8 expected. The night shift has none on Line 2.
In June, one of the two retirees is the night dispatcher for Line 1, and there are no longer any night dispatchers. A versatility matrix shows you this gap and the authorizations that are about to expire.
Independent adjusters, team by team
Fictitious example: a 3×8 shift operation, with a target of 4 adjusters per line (one per shift, plus one on standby).
Morning
Afternoon
Night
Adjustment Technician, Line 1
✓ 2 standalone units
✓ 1 standalone unit
✓ 1 standalone unit
Adjustment Technician, Line 2
✓ 1 standalone unit
✓ 1 standalone unit
✕ No adjuster
There are 6 independent signal operators for 8 scheduled positions. The night shift has none on Line 2.
Morning
Afternoon
Night
Adjustment Technician, Line 1
✓ 2 standalone units
✓ 1 standalone unit
✕ No adjuster
Adjustment Technician, Line 2
✓ 1 standalone unit
✓ 1 standalone unit
✕ No adjuster
There are 5 independent signal operators for 8 expected. By nightfall, there are none left on either line.
Illustrative breakdown by team. The total headcount remains virtually unchanged, but the night shift loses its sole adjustment authority.
Why forecast needs and expenses month by month?
An annual average hides the tough months from you, because The gap is concentrated in just a few months, including those related to time off outside of closures, departures, and peak periods.
A quick calculation compares your workforce to the positions that need to be filled each day and concludes that everything is covered. However, each employee is on duty only about three out of every four days the facility is open.
| Month | Open positions per day, 3 shifts | Operators Present Each Day | Difference | Lever |
|---|---|---|---|---|
| January | 36 | 34,4 | -1,6 | Occasional Overtime |
| May | 36 | 28,3 | -7,7 | Temporary Staffing for Vacation Coverage |
| July | 36 | 27,5 | -8,5 | Temporary Staffing for Vacation Coverage |
| September, an ordinary month | 36 | 32,1 | -3,9 | Permanent Position Recruitment |
| November | 43.2, including peak Saturdays | 32,1 | -11,1 | Volunteer Saturdays, Temporary Work |
| December | 40.7, including peak Saturdays | 29,3 | -11,4 | Volunteer Saturdays, Temporary Work |
The hypothetical workshop in 2027, per workday, before any hiring
Same values as in the table: the gap widens in May, July, and during peak months.
Job Openings by DayOperators Present Each DayThe difference is shown in red
November and December are the busiest Saturdays for job openings.
January is almost fully staffed, as the workshop still has 44 operators before the departures in March and June, not counting time off outside of plant closures. Your schedule is created in four steps.
- The starting point is the current headcount, from which we subtract confirmed departures, followed by estimated probable departures based on your turnover rate.
- Vacation days are scheduled on a month-by-month basis, including the long weekends in May and summer vacation.
- For each month, compare the daily working-day figures to the daily demand, including peak Saturdays.
- Finally, repeat the same calculation using a low volume and a high volume.
A vacant position is counted as one fewer employee on the roster until the new hire arrives. If counted as an absence, it would inflate your rate and complicate the choice of leverage.
Also, enter the dates of any long-term shutdowns that are already known. If they were included in an average rate, they would be excluded from the month in which they occur.
Just read the table line by line. The variance that occurs every month and the one for July do not call for the same corrective action.
Which lever should you choose for each deviation?
We recommend covering the monthly shortfall with a fixed-term contract and keeping temporary work and overtime during peak periods and time off.
The law takes the same approach, since temporary work is intended to cover a replacement, a temporary increase in workload, or seasonal employment—never a long-term position (see the cases in which temporary work is used).
| Lever | Deadline | Limitations | For what difference |
|---|---|---|---|
| Overtime | Immediate | 10 hours per day, 48 hours per week, an average of 44 hours over 12 weeks; 8 hours per day at night; a limit of 220 hours per year without an agreement | A few peak days |
| Reassignment of a Multi-Skilled Employee | Immediate if it is self-contained | Vacates his original position | Unexpected absence from a critical position |
| Temporary Work | Must be ordered before the mission | Legal basis; generally no more than 18 months; enhanced safety training for high-risk positions | Vacation, peak season, replacement |
| Training for a New Position | One to eight weeks, depending on the sector | Additional wait time before startup | Lack of skills in a critical position |
| Permanent Position Recruitment | About six weeks to find (2017 Pôle Emploi survey), followed by notice and training | Industrial recruitment is often difficult | Permanent gap |
| Production Smoothing, Borrowing from Another Workshop | According to the PIC | Smoothing creates inventory that needs to be financed | Expected peak |
In the fictional workshop, the four current employees who will be gone after June bring the total to five, since each one is on the job only about three out of every four days. Two permanent employees will join in April to be trained by those retiring in June, and three more will join in September.
The map ends at 46 operators, which cover the regular months. Increasing the headcount to the 48 FTE used in the calculation would put you over staff during those months, for peak periods and time off that are covered by temporary staff.
What about a critical position? Train a site operator and reassign the temporary worker to their original position. This way, you create the versatility before the peak, and the interim management is limited to simple positions.
Overtime and voluntary Saturday work make up for the shortfall in staffing during vacation months and peak periods. If you schedule your permanent employees during the off-peak period, you’re creating a permanent temporary workforce, which is not permitted by law.
Review the plan every month, right after the PIC
Your workforce plan is being revised every month, right after the PIC, including production, HR, and management accounting.
The PIC sets the pace. Every month, it brings together the sales, manufacturing, and logistics departments to discuss volumes for at least the next 12 months. Your plan translates these volumes into headcount, and five metrics are all you need to track it.
- The gap between needs and donations is tracked month by month.
- Coverage of critical positions is reviewed on a team-by-team basis.
- Overtime hours are tallied per person to identify those who are overworked.
- The proportion of temporary work is measured in hours worked.
- Actual absenteeism is comparable to the rate specified in the plan.
HR handles contracts and employee departures, while production manages positions and output volumes. Work with them to map out the next three months in detail, and ensure that every decision is assigned to a responsible person and has a deadline.
In the example, the July review confirms the November peak, and the versatility training programs begin when operations resume in late August. The temporary workers, who were hired in mid-September, arrive before the first Saturday.
In contrast to the November peak
Fictional example: Each lever is triggered on the date that allows it time to take effect.
- JulyThe monthly report confirms the peak in November.
- Late AugustWhen the facility reopens, the multi-purpose courses will begin.
- Mid-SeptemberTemporary workers have been assigned.
- NovemberTemporary workers are on the job before the first Saturday of the peak season.
For hiring or training, expect it to take roughly 7 to 14 weeks—the median timeframe depending on the industry—before you have a fully independent operator in a critical position.
Excel or workforce planning software?
For a first workshop, A spreadsheet is all you need. It falls apart when your skills, authorizations, and temporary staff change every week.
To get started, set up three tabs.
- The first one lists the hours to be covered by each position per month.
- The second one lays out the needs for those present, month by month.
- The third one counts the number of self-directed workers by critical position and by shift.
When should you switch to software? The right time is as soon as you find yourself re-entering the same data from one file to another. In Mercateam, the skills matrix feeds into the staff scheduling.
Demonstration
Your Skills and Schedule in a single tool
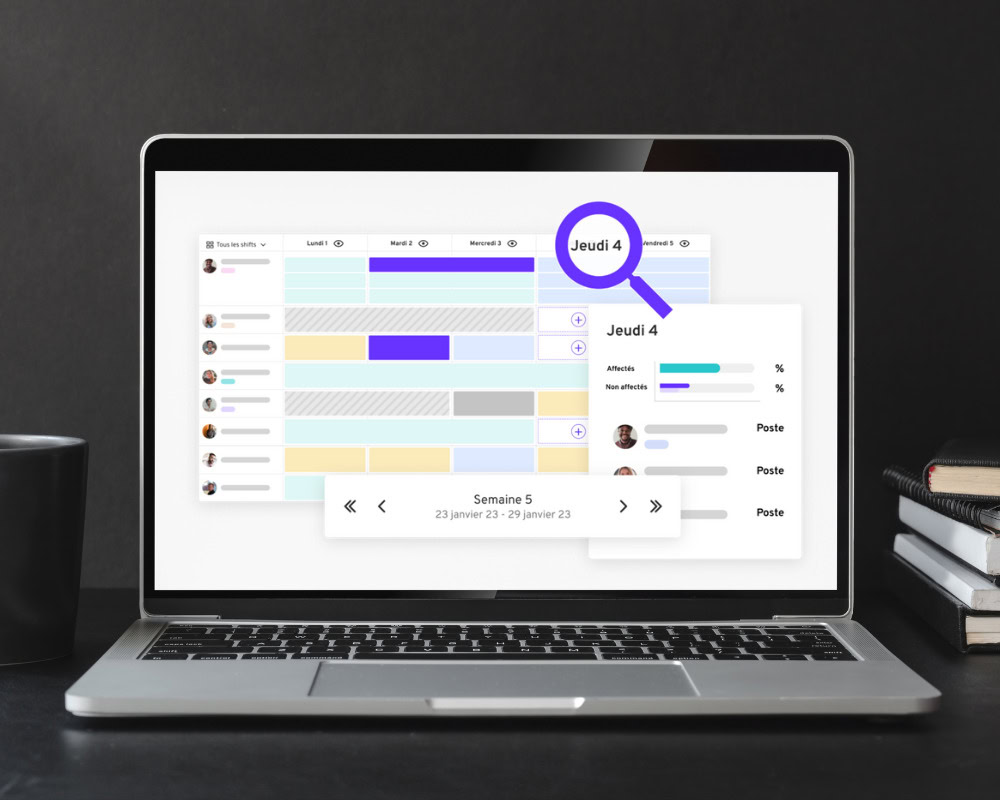
In Mercateam, the skills matrix feeds into the assignment schedule: expiring authorizations and critical understaffed positions are highlighted during the assignment process.
More than 300 industrial sites equipped · HRMS and ERP integration · Hosting in Europe
At Bonduelle, the workforce tripled during the season, with 1,000 temporary workers at two sites, and the scheduling department was responsible for 6 full-time employees across 25 Excel files. Today, 15 managers share a single schedule, with more than 20,000 assignments per month across 400 positions (The Bonduelle Case).
Where should you start on your website?
Start with the workshop that uses the most overtime and temporary workers, and there the complete calculation before expanding it.
- List the positions at this workshop and their hours of operation for the coming year.
- Calculate the available hours per person based on your actual absenteeism over the past 12 months.
- For each critical position, count the number of independent workers by team.
- Next comes the month-by-month schedule, with the date of the first review set in coordination with the production team.
When the budget is being prepared, you will present the finance department with a worksheet detailing the number of independent contractors on a month-by-month basis, along with dated variances that you can justify. To link this plan to your skills matrix and your staffing schedule, request a demo.